

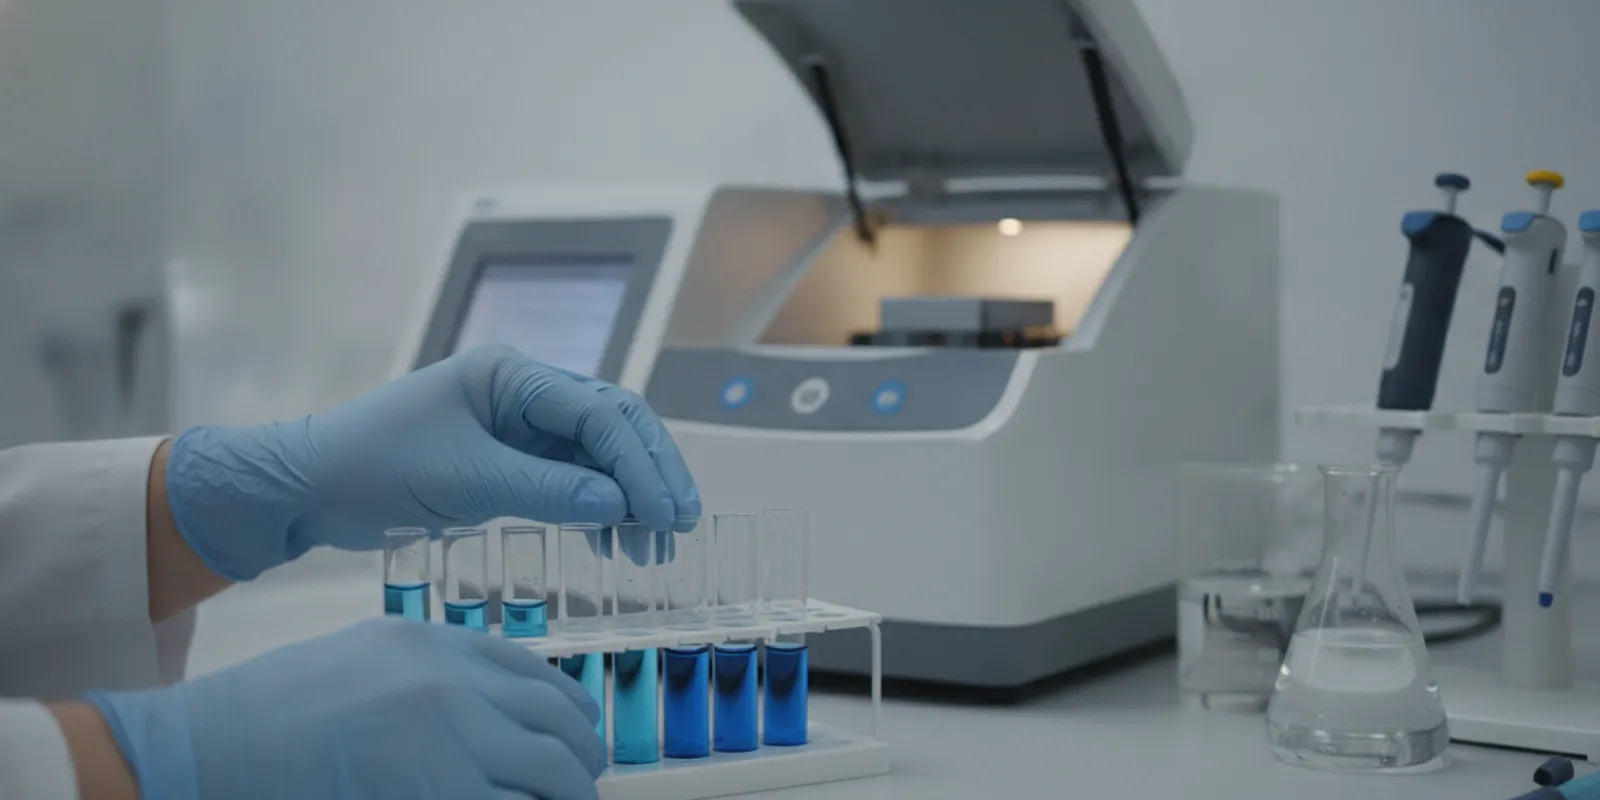
Methylene blue spectrophotometric analysis is a practical way to study how a sample absorbs visible light under defined laboratory conditions. Reliable interpretation depends on more than reading an instrument display: researchers need a well-defined measurement question, suitable blanks and controls, verified calibration, and a record of the sample matrix and instrument settings.
Contact our team about research supply questions
This guide focuses on analytical planning and data quality in laboratory and research settings. It does not provide instructions for personal use. Methylene blue results are method-dependent, so a reported absorbance or calculated concentration should be interpreted only in the context of the specific procedure and its validation.
What question should spectrophotometric analysis answer?
Define the measurand before choosing the instrument
Start by stating what the experiment is intended to measure. A study might need to compare absorbance between prepared samples, estimate the concentration of methylene blue in a defined aqueous matrix, or monitor a change over time. These are related but not interchangeable aims. A comparison may support a relative conclusion under consistent conditions, while a concentration estimate requires a calibration model that is appropriate for the sample and measurement range.
Write down the measurand in operational terms: the analyte, sample type, units, time point or interval, and the decision the result will inform. For example, “compare the absorbance of replicate aqueous preparations at a fixed measurement setting” is more precise than “check dye strength.” This definition helps determine the calibration range, controls, replicates, and reporting format before measurements begin.
Understand what absorbance does—and does not—establish
A spectrophotometer measures light transmitted through a sample at selected wavelengths and reports a corresponding optical signal. In a suitably controlled system, absorbance can be related to analyte concentration through a calibration relationship. That relationship is not a universal property that can be applied without qualification: it depends on the instrument, optical path, solvent or matrix, sample preparation, and measurement conditions.
Absorbance alone does not prove sample identity, purity, or the absence of other absorbing species. A similar signal can arise from matrix effects, background color, turbidity, contamination, or a change in the chemical state of the measured species. Treat a spectrophotometric result as evidence for the stated analytical question—not as a complete characterization of the sample. The published study Visible Light Spectroscopic Analysis of Methylene Blue in Water provides a subject-specific example of visible-light spectroscopic analysis, while also illustrating why method conditions and sample context matter when interpreting a measurement.
Choose wavelength based on the method, not habit
Researchers often select a wavelength based on a validated or published method, or first scan a representative preparation to identify a suitable region of the visible spectrum. The appropriate choice depends on the analytical objective and matrix. When establishing or adapting a method, record how the wavelength was selected and whether the observed spectrum is consistent across replicate preparations.
A wavelength used in one instrument or formulation should not automatically be assumed optimal for every laboratory. Bandwidth, optical configuration, sample background, and instrument performance can affect the observed signal. If an existing method specifies a setting, follow its validated procedure and document any deliberate deviation. If developing a method, include a wavelength-selection rationale and preserve the scan or supporting record.
Separate analytical response from sample identity
Questions about concentration and identity may require different analytical evidence. Spectrophotometry can provide a useful response measurement, but it does not independently establish molecular identity. When identity or composition is a critical study attribute, plan an appropriate complementary analytical method and define how its results will be reconciled with the optical measurement.
Keep the claims in a report aligned with the evidence actually collected. “Absorbance measured under the stated conditions” is a direct observation. “Concentration estimated from the calibration curve” is an interpreted result that depends on the calibration assumptions. “Confirmed identity” is a broader claim and should not be made on the basis of absorbance alone.
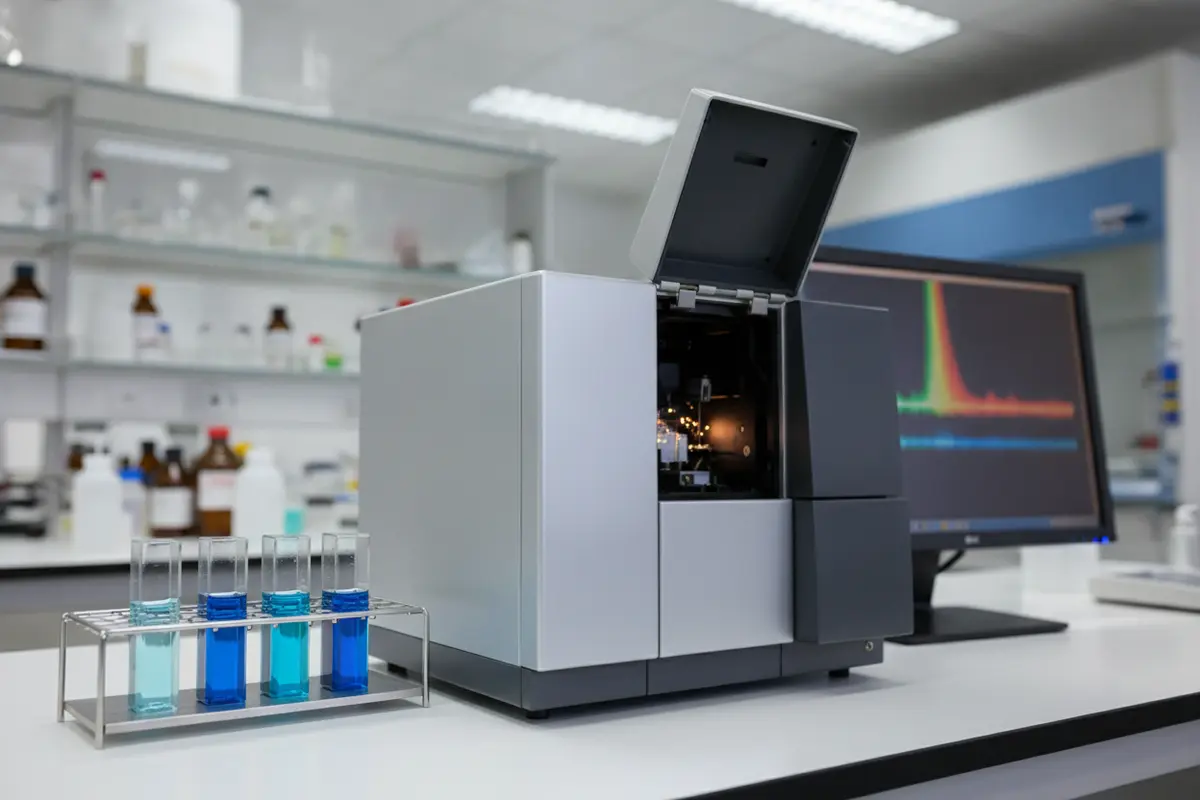
How should assay conditions and controls be planned?
Build a calibration set that covers the intended range
Calibration standards should be prepared using a documented procedure and concentrations that cover the range relevant to the study. Include enough levels to evaluate the relationship between concentration and instrument response, rather than relying on a single comparison point. The number and distribution of standards should be set by the method’s validation plan and the intended use of the result.
Prepare standards and unknowns in compatible matrices whenever possible. A mismatch between standard and sample matrices can introduce a systematic difference that a simple calibration curve will not correct. Record the source and lot of reference material, preparation records, dilution steps, units, and any calculations used. Avoid reporting more precision than the calibration and instrument performance support.
Use blanks to identify background contributions
A reagent or solvent blank helps establish the baseline contribution from the measurement medium and handling materials. If the sample matrix itself absorbs or scatters light, a matrix-matched blank may be needed to distinguish analyte response from background. Choose the blank to reflect the question being asked, and explain its composition in the method record.
Blank correction is not a substitute for understanding the source of an unexpected signal. A large or unstable blank response can point to contaminated reagents, inconsistent cuvettes, sample carryover, or an unsuitable matrix. Define in advance how the laboratory will respond to blank values outside the acceptable range, including whether the run is repeated or investigated.
Include controls and replicates for different purposes
A control sample can help determine whether the method performs consistently over time or between runs. Replicate measurements can show short-term variability, while independently prepared replicates also capture some preparation variability. These designs answer different questions; repeated readings from one prepared cuvette are not equivalent to separate preparations from the original sample.
Set the number and type of replicates based on study objectives, expected variability, and the method’s performance requirements. Randomizing measurement order can help reveal drift or order effects when many samples are processed. Include a control at a useful point in the sequence and state how the results will be evaluated. A control is meaningful only when its expected behavior and response to an out-of-range result are established in advance.
Keep optical handling consistent
Use compatible cuvettes and a consistent orientation, fill level, and cleaning procedure. Inspect optical faces for fingerprints, droplets, scratches, bubbles, or residue before measurement. Handle samples consistently and minimize avoidable differences in elapsed time between preparation and reading, especially when the study is designed to compare time-dependent observations.
Follow instrument guidance for warm-up, baseline checks, wavelength setting, and maintenance. Record the instrument identifier, measurement mode, wavelength, bandwidth or other relevant settings, and date of the run. When multiple instruments are involved, evaluate comparability instead of assuming that readings transfer directly between units.
Consider matrix, light exposure, and timing
Sample composition can affect the measured signal through background absorption, scattering, pH, ionic environment, or interactions among components. These factors should be treated as method variables, not dismissed as noise. If a matrix change is introduced, assess whether the calibration and controls remain suitable before comparing results across conditions.
Document preparation-to-measurement timing and any light-protection or storage conditions specified in the study procedure. Avoid adding unsupported assumptions about stability: assess stability under the actual experimental conditions if it matters to the question. The study On the spectrophotometric measurement of methylene blue specifically addresses measurement behavior in aqueous solution, underscoring that solution conditions can be relevant to the signal. Researchers should consult the full method and determine applicability rather than transferring a condition without verification.
| Element | What it helps assess | What to record | | --- | --- | --- | | Solvent or reagent blank | Background from measurement medium and handling | Composition, preparation date, and response | | Matrix-matched blank | Background from sample matrix apart from the target response | Matrix source, preparation, and correction approach | | Calibration standards | Relationship between known preparation levels and instrument response | Reference material, levels, units, curve model, and fit review | | Control sample | Consistency of method performance within or between runs | Control identifier, expected range, observed response, and disposition | | Replicate samples | Measurement or preparation variability, depending on design | Replicate type, number, individual results, and summary approach |
Plan a practical run sequence
A written sequence reduces avoidable variation and makes the run easier to review. A typical sequence may include instrument checks, blank measurement, calibration standards, control material, samples, and periodic checks or repeat measurements specified by the method. The order should be appropriate to the assay and should include a clear approach to carryover prevention and reruns.
Make the protocol operational. State who prepares and verifies samples, how sample identifiers are assigned, how instrument files are named, and where raw data are retained. If an unexpected result occurs, preserve the original record and document the investigation; do not silently replace a result with a repeat measurement.

How can researchers validate and document results?
Evaluate calibration behavior rather than relying on one number
Review the calibration plot and residual behavior, not only a summary statistic such as a correlation coefficient. A strong-looking fit statistic does not by itself show that the model is appropriate throughout the range. Look for curvature, influential points, uneven residuals, and evidence that the response is outside the useful measurement range. Define acceptance criteria before the run and document how each criterion was assessed.
Check whether unknown sample responses fall within the validated calibration interval. Extrapolating beyond that interval can produce uncertain estimates. If a sample response requires a different measurement range, follow a documented preparation or dilution procedure established for the research method, then verify that the adjusted measurement remains within its validated conditions. This article does not prescribe sample-specific preparation steps.
Assess precision, bias, and range as separate properties
Precision describes the closeness of repeated results under stated conditions; it does not establish that results are near an accepted reference value. Bias concerns systematic difference from an appropriate reference or expected value. The useful analytical range is the region where the method provides adequate performance for the intended purpose. A method record should distinguish these concepts and describe the evidence used to evaluate each one.
Validation depth should match how the data will be used. A preliminary comparison may require a different level of evidence from a method intended to support a formal study decision. At minimum, define the intended range and matrix, assess repeatability, examine blank and control behavior, and determine whether the calibration model is suitable. Add other evaluations when the research question or laboratory quality system requires them.
Investigate interferences and changes to the method
Potential interferences include other absorbing components, turbidity, precipitation, cuvette variation, and changes in solution conditions. A method may also be affected by changes in instrument settings, reagent lots, sample handling, or measurement timing. List known and plausible influences during method development, and determine which ones require a control, exclusion criterion, or additional investigation.
When a method is transferred or modified, identify the changed elements and evaluate their effect before pooling new measurements with earlier data. Changes to wavelength, matrix, instrument, path length, or calibration preparation can make results less directly comparable. Preserve version history for procedures and explain the basis for any equivalence claim.
Maintain traceable records from preparation to report
A useful analytical record connects the reported result to the original measurement. Capture sample and standard identifiers, lot information, preparation records, instrument and settings, raw absorbance data, blank correction, calibration data, calculations, control outcomes, and any deviations. Keep instrument-generated files and calculation worksheets under the laboratory’s record-retention process.
Report the method version and enough detail for a qualified reader to understand how the measurement was made. Include the matrix, wavelength, calibration approach, replicate design, relevant acceptance criteria, and limitations. Report individual replicate values when useful, not only a rounded mean. If a result is excluded or repeated, state the reason and retain the original observation in the audit trail.
Use complementary quality records appropriately
Analytical documentation for a supplied research compound is distinct from a laboratory’s own assay validation. A supplier’s certificate of analysis may provide batch-specific quality information, but it does not validate a downstream spectrophotometric procedure or prove that a particular sample matrix is suitable. Researchers should review records in relation to the study’s own acceptance criteria.
For general supplier documentation, review the COA Library and the company’s purity and testing information. The research catalog and research supply FAQ can also help procurement teams locate relevant product and ordering information. A certificate should be interpreted according to its listed batch, analytical method, and stated result; it is not a substitute for study-specific controls.
Ask our team about research supply documentation
Frequently Asked Questions
Can absorbance alone confirm methylene blue identity?
No. Absorbance is an optical measurement under specified conditions. It can support a defined analytical comparison or concentration estimate when the method is appropriate, but it does not by itself confirm identity or purity. Use complementary analytical evidence when those attributes are necessary to the research question.
Do all laboratories use the same wavelength?
Not necessarily. Follow a validated procedure where one applies, and document its specified wavelength. When developing or adapting a method, select a wavelength based on the analytical objective, instrument, sample matrix, and supporting data. Do not assume that a setting from one setup transfers unchanged to another.
Why include both blanks and controls?
Blanks help assess background contributions from the solvent, reagents, or matrix. Controls help assess whether the method behaves as expected during a run or across runs. They answer different questions, so one should not automatically be treated as a replacement for the other.
Can a supplier certificate replace validation of a laboratory method?
No. A certificate of analysis documents specified information for a particular batch and method. It does not establish that a separate laboratory assay is suitable for a particular matrix, instrument, or research objective. Validate the laboratory procedure for its intended use and review supplier documents within that context.
What should be reported with a spectrophotometric result?
At a minimum, provide the sample matrix, method version, wavelength and relevant instrument settings, calibration approach, blank and control treatment, replicate design, units, and limitations. Retain raw data and explain deviations, reruns, and excluded values so that the interpretation remains traceable.
Research Documentation for Your Next Study
Sound methylene blue spectrophotometric analysis begins with a narrowly defined measurement question and a method suited to the sample matrix. Consistent controls, calibration review, instrument handling, and traceable records help readers judge what the data support and where uncertainty remains. For research supply questions, contact Trusted Peptides or review the company information.
FDA Disclaimer:The statements made within this website have not been evaluated by the US Food and Drug Administration. The statements and the products of this company are not intended to diagnose, treat, cure or prevent any disease. All products are sold for research, laboratory, or analytical purposes only, and are not for human consumption. TPRX LLC is a chemical supplier. TPRX LLC is not a compounding pharmacy or chemical compounding facility as defined under 503A of the Federal Food, Drug, and Cosmetic act. TPRX LLC is not an outsourcing facility as defined under 503B of the Federal Food, Drug, and Cosmetic act.